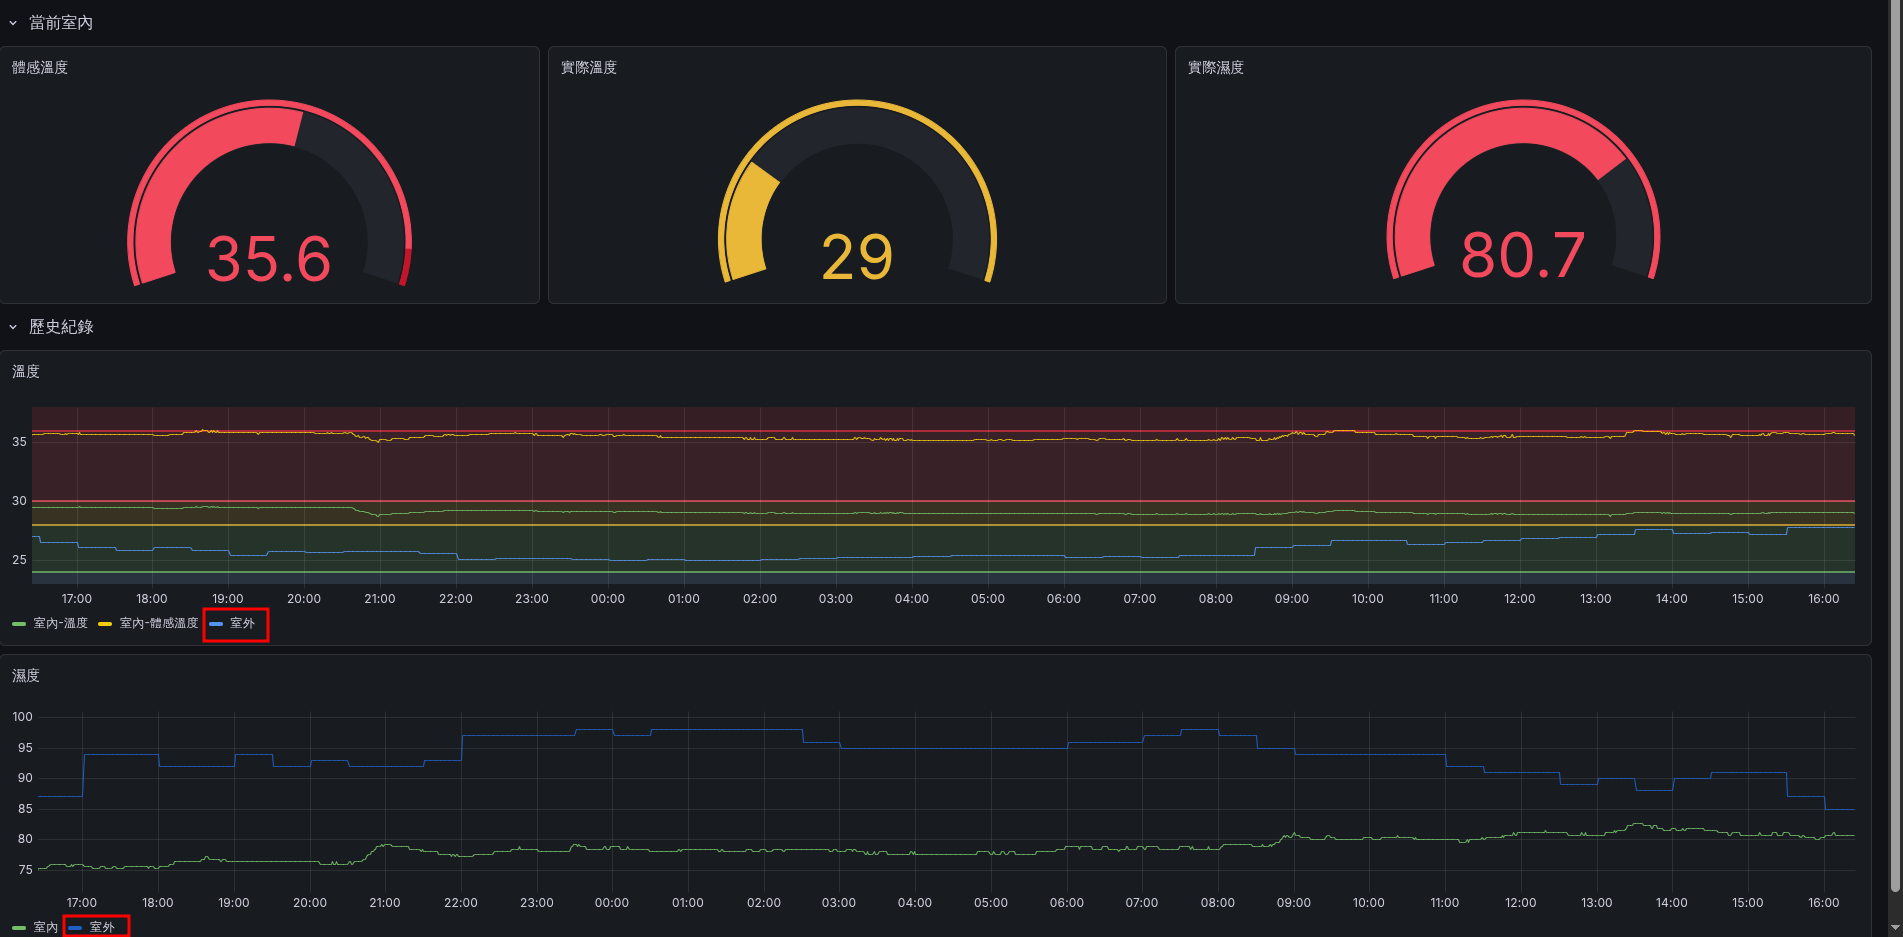
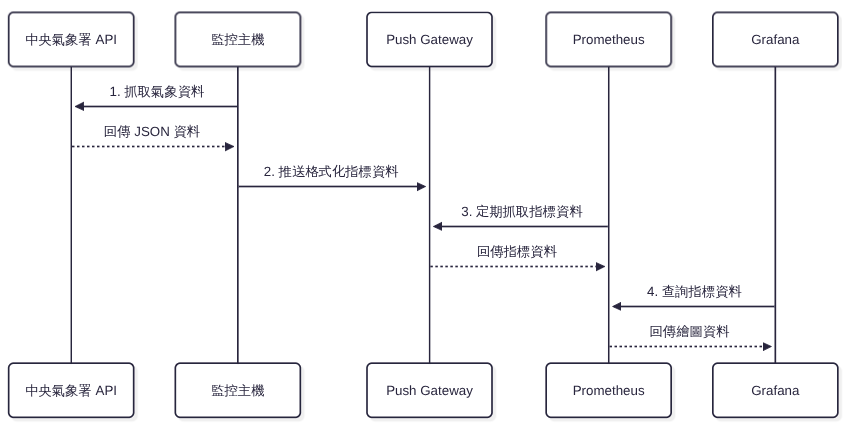
快轉到主要內容

如何紀錄氣象監控資訊

·1381 字·3 分鐘·
PolloChang
作者
PolloChang
我是一隻雞

最後呈現結果
#

alt text

系統架構設計
#

  • 中央氣象署-開放資料平臺 提供氣象監控資訊
  • 監控主機 負責抓取 API 資料
  • prometheus push gateway 負責接收 prometheus 資料
  • Prometheus 負責抓取 prometheus push gateway 資料
  • Grafana 從 Prometheus 繪製資料
1
2
3
4
5
graph LR
    A[中央氣象署<br>開放資料平臺] -->|提供 API 資料| B(監控主機)
    B -->|推送資料| C(Push Gateway)
    C -->|拉取資料| D(Prometheus)
    D -->|查詢資料| E(Grafana)

系統架構設計

資訊流設計
#

  1. 監控主機抓取 API 資料
  2. 將資料傳送到 prometheus push gateway
  3. Prometheus 抓取 prometheus push gateway 資料
  4. Grafana 從 Prometheus 繪製資料
 1
 2
 3
 4
 5
 6
 7
 8
 9
10
11
12
13
14
sequenceDiagram
    participant CWA as 中央氣象署 API
    participant Server as 監控主機
    participant PG as Push Gateway
    participant Prom as Prometheus
    participant Grafana as Grafana

    Server->>CWA: 1. 抓取氣象資料
    CWA-->>Server: 回傳 JSON 資料
    Server->>PG: 2. 推送格式化指標資料
    Prom->>PG: 3. 定期抓取指標資料
    PG-->>Prom: 回傳指標資料
    Grafana->>Prom: 4. 查詢指標資料
    Prom-->>Grafana: 回傳繪圖資料

資訊流設計

實做紀錄
#

  1. 到 中央氣象署-開放資料平臺 加入會員 並申請 API Key

URL: https://opendata.cwa.gov.tw/index

註記

取得授權碼: 註冊並登入後,至會員中心取得「授權碼 (Authorization Token)」,這是在後續呼叫 API 時驗證身分用的必要資訊。

  1. 測試 URL
1
2
3
curl -X 'GET' \
  'https://opendata.cwa.gov.tw/api/v1/rest/datastore/O-A0003-001?Authorization=<API Key>&format=JSON' \
  -H 'accept: application/json'
提示

資料結構確認: 建議先在終端機執行這個指令確認 API 授權碼是否有效,並觀察回傳的 JSON 資料結構,這有助於了解稍後使用 jq 工具解析資料的邏輯。

  1. 建立抓取資料腳本 與 排程
註記

工作原理: 我們會先撰寫一支 Bash 腳本 (get-weather-to-prometheus.sh),負責向氣象署 API 請求資料,並轉換成 Prometheus 認可的指標 (Metrics) 格式,最後將結果推送到 Push Gateway。接著,透過 Systemd 建立定期排程來自動執行這支腳本。

  • get-weather-to-prometheus.sh
 1
 2
 3
 4
 5
 6
 7
 8
 9
10
11
12
13
14
15
16
17
18
19
20
21
22
23
24
25
26
27
28
29
30
31
32
33
34
35
36
37
#!/bin/bash

TOKEN="<API Key>"

# StationId: https://hdps.cwa.gov.tw/static/state.html
STATION_ID=466920

# API 網址
API_URL="https://opendata.cwa.gov.tw/api/v1/rest/datastore/O-A0003-001?Authorization=${TOKEN}&format=JSON&StationId=${STATION_ID}&WeatherElement=AirTemperature,RelativeHumidity&GeoInfo=StationAltitude"

PUSHGATEWAY_URL="http://127.0.0.1:9091/metrics/job/weather_station"

# 從 API 取得資料並用 jq 解析
DATA=$(curl -X 'GET' -H 'accept: application/json' -s "$API_URL" | jq -r '.records.Station[] | {name: .StationName, temp: .WeatherElement.AirTemperature, humid: .WeatherElement.RelativeHumidity}')

# 提取資料
STATION_NAME=$(echo "$DATA" | jq -r '.name')
AIR_TEMP=$(echo "$DATA" | jq -r '.temp')
REL_HUMID=$(echo "$DATA" | jq -r '.humid')

# 建立 Prometheus 格式的資料
# 使用站名作為標籤,溫度與濕度作為指標
METRICS=$(cat <<EOF
# TYPE weather_temperature gauge
weather_temperature{station="$STATION_NAME"} $AIR_TEMP
# TYPE weather_humidity gauge
weather_humidity{station="$STATION_NAME"} $REL_HUMID
EOF
)

# 推送資料到 Pushgateway
echo "$METRICS" | curl --data-binary @- "$PUSHGATEWAY_URL"

# 顯示結果(可選)
echo "站名: $STATION_NAME"
echo "氣溫: $AIR_TEMP°C"
echo "相對濕度: $REL_HUMID%"
註記

腳本重點說明:

  • 資料解析 (jq):因為氣象局回傳的 JSON 資料非常龐大,我們使用 jq 指令精準篩選出測站名稱 (StationName)、氣溫 (AirTemperature) 與相對濕度 (RelativeHumidity)。
  • 指標格式設計:Prometheus 接收的資料格式為 指標名稱{標籤名稱="標籤值"} 數值。我們將測站名稱設計成標籤 (Label: station="$STATION_NAME"),這樣未來在 Grafana 畫圖時,如果有多個測站資料,就能輕鬆切換與篩選。
  • 推送至 Push Gateway:透過 curl --data-binary 將純文字格式的指標以 HTTP POST 方法推送到 Push Gateway 指定的 Job 端點 (/metrics/job/weather_station)。
  • /etc/systemd/system/get-weather.service
1
2
3
4
5
6
[Unit]
Description=Update weather data for Prometheus

[Service]
ExecStart=/usr/local/bin/get-weather-to-prometheus.sh
Type=oneshot
註記

Service 設定說明:

  • Type=oneshot:代表這個服務啟動後,執行完一次 ExecStart 所指定的腳本就會自動結束。這種設定非常適合用來搭配定時器 (Timer) 單次觸發執行。
  • /etc/systemd/system/get-weather.timer
1
2
3
4
5
6
7
8
9
[Unit]
Description=Run weather update every 30 minutes

[Timer]
OnCalendar=*-*-* *:00,30:00
Persistent=true

[Install]
WantedBy=timers.target
註記

Timer 設定說明:

  • OnCalendar=*-*-* *:00,30:00:這行定義了排程的時間。表示在每天每小時的 00 分30 分 各觸發一次,也就是每半小時更新一次氣象資料。
  • Persistent=true:如果系統因為關機或重開機錯過了排定的執行時間,系統開機後會立刻補執行一次,確保資料不會遺漏太久。

最後,載入設定並啟動排程:

1
2
3
sudo systemctl daemon-reload
sudo systemctl enable get-weather.timer
sudo systemctl start get-weather.timer