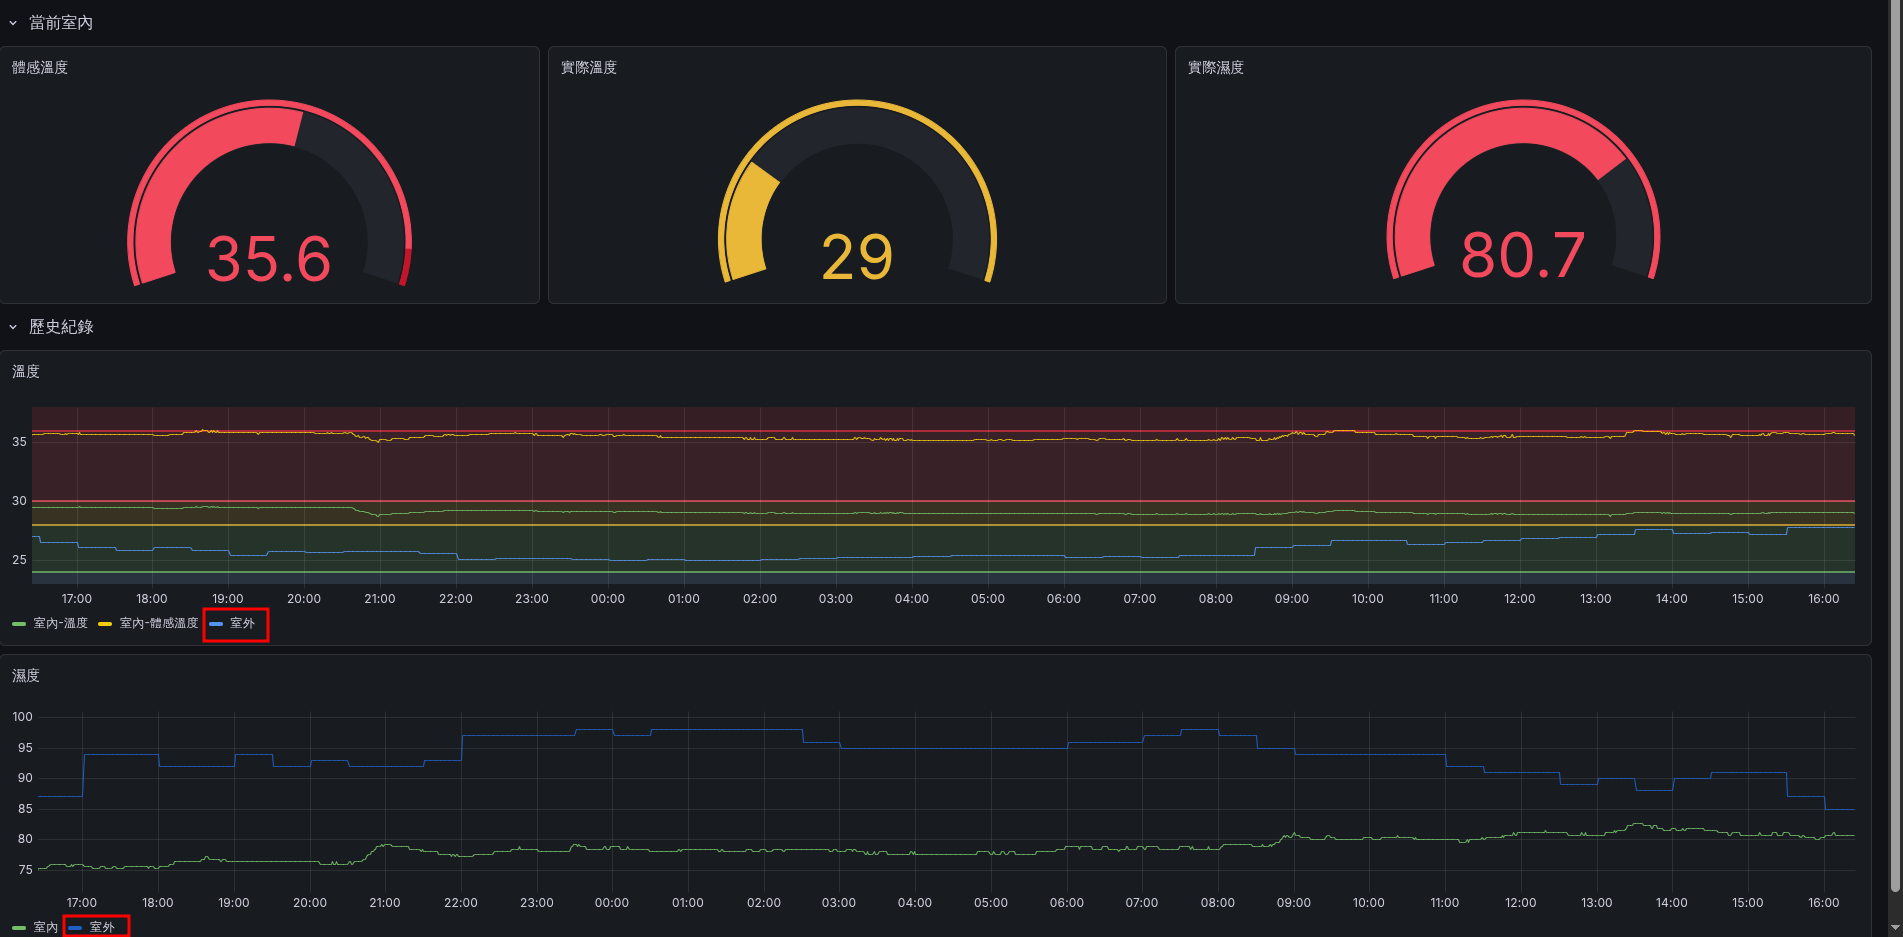
Final Result #
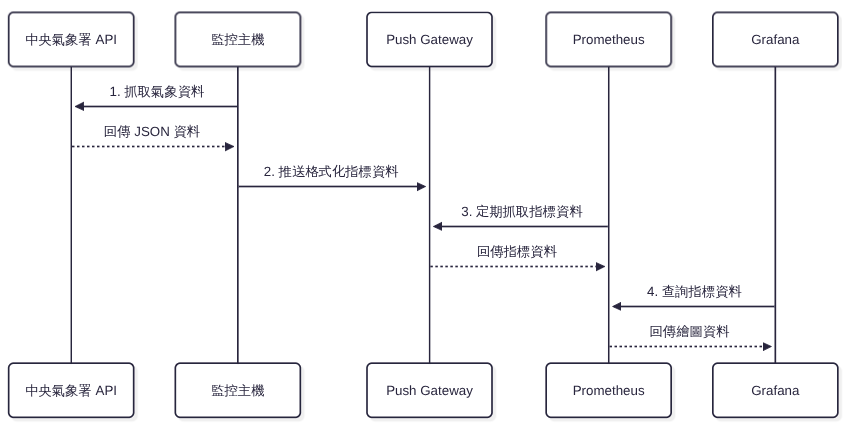
System Architecture Design #
- Central Weather Administration Open Data Platform: Provides weather monitoring data
- Monitoring Server: Responsible for fetching API data
- Prometheus Pushgateway: Responsible for receiving Prometheus metrics
- Prometheus: Responsible for scraping data from the Prometheus Pushgateway
- Grafana: Visualizes data from Prometheus
|
|

Data Flow Design #
- The monitoring server fetches API data
- Sends the data to Prometheus Pushgateway
- Prometheus scrapes data from Prometheus Pushgateway
- Grafana visualizes data from Prometheus
|
|
Implementation Notes #
- Register as a member on the Central Weather Administration Open Data Platform and apply for an API Key
URL: https://opendata.cwa.gov.tw/index
Get the Authorization Token: After registering and logging in, go to the Member Center to obtain the “Authorization Token”. This is essential information for verifying your identity when calling the API later.
- Test the URL
|
|
Verify Data Structure: It is recommended to run this command in the terminal first to confirm whether the API authorization token is valid, and to observe the returned JSON data structure. This helps you understand the logic of parsing data using the jq tool later.
- Create the data scraping script and schedule
How it works: We will first write a Bash script (get-weather-to-prometheus.sh) that requests data from the CWA API, converts it into the metrics format recognized by Prometheus, and finally pushes the results to the Pushgateway. Then, we use Systemd to create a recurring schedule to automatically run this script.
- get-weather-to-prometheus.sh
|
|
Script Highlights:
- Data Parsing (
jq): Because the JSON data returned by the CWA is very large, we use thejqcommand to precisely extract the station name (StationName), air temperature (AirTemperature), and relative humidity (RelativeHumidity). - Metrics Format Design: The data format accepted by Prometheus is
metric_name{label_name="label_value"} value. We design the station name as a label (Label:station="$STATION_NAME"), so that in the future, when plotting in Grafana, if there are multiple stations’ data, it will be easy to switch and filter. - Push to Pushgateway: Use
curl --data-binaryto push the plain text formatted metrics via the HTTP POST method to the specified Job endpoint of the Pushgateway (/metrics/job/weather_station).
- /etc/systemd/system/get-weather.service
|
|
Service Configuration Notes:
Type=oneshot: This means that after this service starts and executes the script specified byExecStartonce, it will automatically terminate. This setting is highly suitable for single-trigger execution paired with a Timer.
- /etc/systemd/system/get-weather.timer
|
|
Timer Configuration Notes:
OnCalendar=*-*-* *:00,30:00: This line defines the schedule. It means it triggers twice every hour of every day, at minute 00 and minute 30, updating the weather data every half hour.Persistent=true: If the system misses the scheduled execution time due to shutdown or reboot, it will immediately execute once after the system boots up, ensuring data is not missed for too long.
Finally, reload the configuration and start the schedule:
|
|